Basketball Shot Chart Template (Free Printable PDF)
August 24, 2026
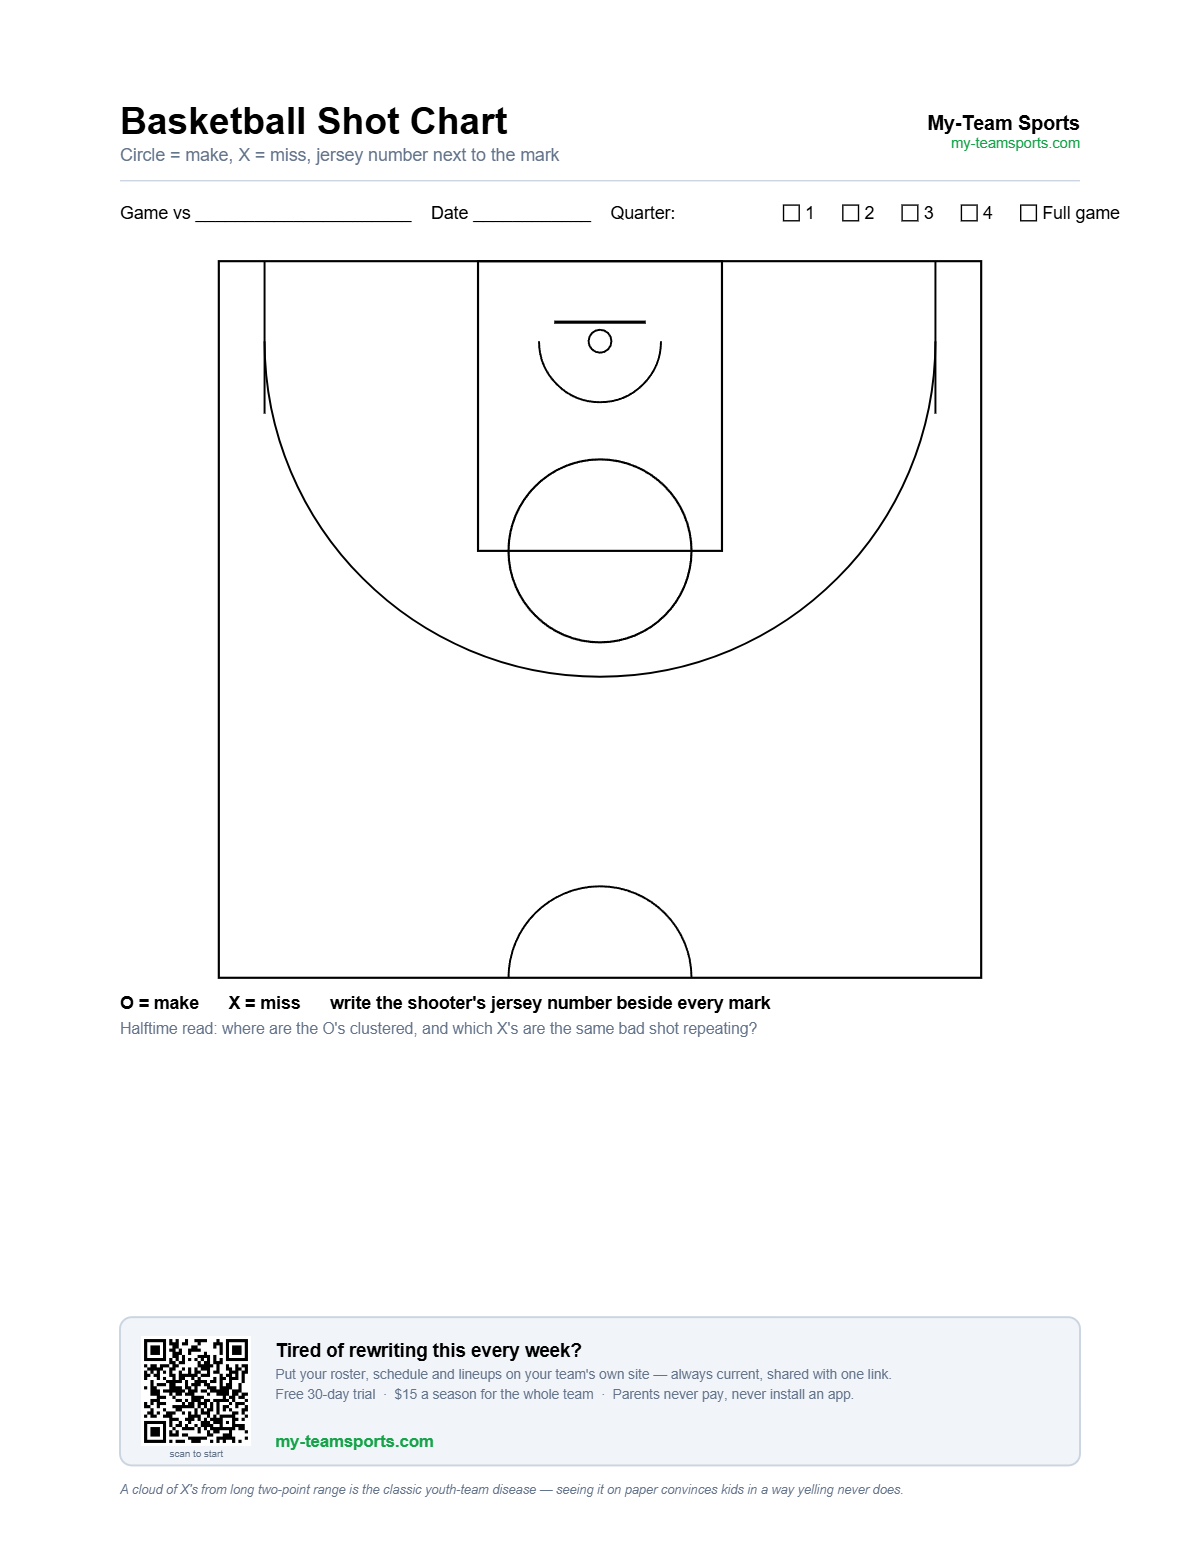
A shot chart is the cheapest scouting tool in basketball: one page, one pen, and by halftime you know exactly where your points come from and which shots you should stop taking. The problem with most free templates is that they're one blank half court — fine for marking makes and misses, useless for adding anything up. This printable is four charts in one PDF: a 12-zone chart with a tally table, a full-page game chart, four quarter charts, and a five-spot shooting chart for practice. Pick the page that matches the job.
Which shot chart do you need?
| Chart | Best for | Who keeps it |
|---|---|---|
| Zone chart (page 1) | Adding it up: makes and attempts by zone, so you get a made % for the paint, the mid-range and each three-point spot | A parent on the bench — tally marks, no drawing |
| Game chart (page 2) | Seeing the pattern: every attempt marked where it happened, with the shooter's number | An injured player or a parent |
| Quarter charts (page 3) | Seeing what changes: lay four courts side by side and watch shot selection fall apart in the fourth | Same person, new box each quarter |
| Shooting chart (page 4) | Practice, not games: 10 shots from five spots, makes out of 10 per player, charted every two weeks | The coach, at practice |
The 12 zones, and what a good youth chart looks like
The zone chart splits the half court the way a scouting report does: at the rim, the rest of the paint, five mid-range zones, and five three-point zones. That's the split that actually answers a coach's questions, because the value of a shot changes at those lines and nowhere else.
| Zones | Where | Good sign | Bad sign |
|---|---|---|---|
| 1–2 | At the rim and the paint | Most of your attempts and most of your makes live here | Attempts are here but makes aren't — finishing, not shot selection, is the problem |
| 3–7 | Mid-range: baselines, wings, top of the key | A few attempts from players who've earned them | The cloud of X's. Long twos are the lowest-value shot on the floor and the one youth teams take most |
| 8–9 | Corner threes | Open corner looks that came from a drive-and-kick | Zero attempts — your offense never gets the ball there |
| 10–12 | Wing and top threes | Taken in rhythm, off a pass | Taken off the dribble with 20 seconds left on the clock |
A healthy youth chart is heavy in zones 1 and 2, light in zones 3 through 7, and shows a few makes in 8 and 9. If your chart is the opposite — X's everywhere in the mid-range, nothing at the rim — the offense isn't getting the ball where it scores, and no shooting drill will fix that. That's a sets problem, not a shooter problem.
How to mark it
Game chart: circle for a make, X for a miss, jersey number next to the mark. That's the whole system. A parent on the bench can keep it after thirty seconds of instruction, and unlike a stat sheet it captures the thing box scores hide — location. Ten misses spread around the arc and ten misses all from the same broken corner possession are very different problems, and only the chart can tell them apart.
Zone chart: one tally mark in the Attempts column for every shot, and another in the Makes column if it drops. At the half, divide. Youth teams rarely take more than 50 shots a game, so the tally is faster than drawing and the percentages are ready before the kids are back on the floor.
What one game of marks tells you
Three things show up almost immediately. Shot selection: a cloud of X's from long two-point range is the classic youth-team disease, and seeing it on paper convinces kids in a way yelling never does. Where your points live: most youth teams score in a small area — usually the paint — and the chart tells you whether your offense is actually getting the ball there. And who's hunting bad shots: numbers next to the marks make the conversation specific instead of personal.
Turn the game chart into practice: the shooting chart
The game chart tells you which shots to stop taking. The shooting chart on page 4 tells you which ones to keep practicing until they're back on the menu. Five spots — both corners, both wings, top — ten shots each, partner rebounds and counts, makes out of ten go in the box. Tick the distance (free-throw line, mid-range, or three) so weeks compare. The rule that makes it useful: under 4 of 10 from a spot in practice means that shot is off the menu in games, and the kid knows it because he charted it himself. Run it every two weeks; the trend matters more than any one day.
The film session without film
Nobody has game film at the rec level, but a shot chart on the whiteboard is eighty percent of one. Lay the quarter charts side by side at practice and let players find the pattern themselves — where did we score, where did we miss, what changed in the fourth. Then build the week's practice around the answer: if the chart says paint points, you drill finishing; if it says corner threes nobody rebounds, you fix the shot selection first.
Chart the shots, score the game live
The chart covers where — My-Team Sports covers everything else. The live basketball scoreboard tracks the score from your phone while parents follow along on the team site, the Coach's Playbook draws the sets that get the ball to zones 1, 2, 8 and 9, and the AI assistant coach turns what the chart told you into a practice plan. Print the chart, clip it to the bench, done.
Related coaching tools
Frequently asked questions
How do you fill out a basketball shot chart?
Mark every attempt on the court diagram where it was taken: a circle for a make, an X for a miss, with the shooter's jersey number next to the mark. On a zone chart, add a tally mark under Attempts for every shot and under Makes when it drops, then divide at halftime. Use one chart per game, or the per-quarter page for more detail.
What is a zone shot chart?
A shot chart that divides the half court into scoring zones — at the rim, the paint, mid-range areas, and three-point spots — and records makes and attempts per zone instead of individual dots. It's the format scouting reports use, because it gives you a shooting percentage for each area of the floor after one game.
What does a shot chart tell you?
Three things a box score can't: shot selection (are you living in the low-value long-two zone), where your points actually come from, and which players are taking shots outside the offense. At the youth level it doubles as a film session — the pattern on paper convinces players faster than a lecture.
What's the difference between a shot chart and a shooting chart?
A shot chart records game attempts by location. A shooting chart records practice shooting — a set number of shots from fixed spots, scored as makes out of ten — so you can track whether a player's shot is improving from the spots that matter. The PDF includes both.
Who should keep the shot chart?
A parent or a player who isn't dressed that game. The circle/X/jersey-number system takes thirty seconds to learn, and it's one of the best jobs to give an injured player — they watch the game more closely than anyone.